
Knowing how to calculate food cost is the fastest way to see whether your menu prices and your kitchen are doing their jobs. You need two numbers: what the food you used cost, and what you sold. There are two versions worth tracking. Actual food cost measures the whole kitchen over a week or a month. Plate cost measures each dish on the menu. Below are the formulas, worked examples with round numbers, and the mistakes that throw the numbers off.
How to calculate food cost percentage for a period
Food cost % = (beginning inventory + purchases minus ending inventory) ÷ food sales × 100
The part in parentheses is your cost of food sold for the period: what you had, plus what came in the back door, minus what's still on the shelves.
Worked example for one month:
- Beginning inventory: $10,000
- Purchases: $30,000
- Ending inventory: $8,000
- Cost of food sold: $10,000 + $30,000 minus $8,000 = $32,000
- Food sales: $100,000
- Food cost: $32,000 ÷ $100,000 × 100 = 32 percent
A few habits keep the number accurate:
- Count at the same time every period, ideally after close on the last day.
- Use current invoice prices for every item you count.
- Keep beverage separate. Food purchases go against food sales only, and sales should exclude tax and tips.
- Account for transfers. Lemons and cream that go to the bar, or wine that goes into a sauce, should move between food and beverage cost.
- Pick one way to handle staff meals and comps, and treat them the same way every period.
How often to count
A full count once a month feeds your P&L. A weekly count of the high-dollar items, like proteins, seafood, dairy, and produce, lets you catch a problem in week two instead of finding it after the month closes. Same counter, same order, same time of day each week makes the numbers comparable.
How to calculate plate cost
Plate cost tells you what a single dish costs to make.
Plate cost % = ingredient cost per plate ÷ menu price × 100
Worked example: a burger with fries, using round numbers. Use your own invoices and recipes.
| Ingredient | Portion | Cost |
|---|---|---|
| Ground beef at $4.00 per lb | 6 oz | $1.50 |
| Bun | 1 | $0.50 |
| Cheese | 1 slice | $0.25 |
| Lettuce, tomato, onion, and pickles | 1 serving | $0.35 |
| House sauce | 1 oz | $0.15 |
| Fries | 5 oz | $0.50 |
| Ketchup and garnish | 1 serving | $0.25 |
| Plate cost | $3.50 |
At a $14 menu price, the plate cost is $3.50 ÷ $14 × 100 = 25 percent.
Build a costed recipe card like this for every dish, and update it when invoice prices move. A recipe card with last year's beef price is a guess.
Account for yield
Most proteins and a lot of produce lose weight to trimming and cooking. If you cost by the purchase price, every plate looks cheaper than it is.
Edible portion cost = as-purchased cost ÷ yield percentage
Worked example: a whole beef tenderloin costs $14 a pound as purchased. After trimming, you keep 70 percent of the weight.
- Edible portion cost: $14 ÷ 0.70 = $20 a pound
- An 8-ounce portion: $20 × 0.5 = $10.00
- Costed at the purchase price, the same portion looks like $7.00
That $3 gap on 50 steaks a week is $150 a week, or $7,800 a year, in cost you never priced for. Run a yield test on each major protein: weigh it as purchased, trim it the way your kitchen does, weigh the usable product, and divide the usable weight by the starting weight to get your yield percentage.
How to price a dish from a target food cost
Menu price = plate cost ÷ target food cost percentage
Worked example: a pasta dish has a plate cost of $4.00, and your target is 28 percent. $4.00 ÷ 0.28 = $14.29. You might round down to $14, which is a 28.6 percent food cost, or up to $15, which is about 26.7 percent.
Percentages aren't the whole story. A $36 steak at a 40 percent food cost leaves $21.60 after food cost. A $14 pasta at 28.6 percent leaves $10.00. The steak has the worse percentage and the bigger contribution, and contribution dollars are what pay the rent. That trade-off is the heart of menu engineering.
Actual vs. theoretical food cost
Theoretical food cost is what you should have spent if every plate went out exactly to recipe.
Theoretical food cost % = sum of (plate cost × items sold) ÷ food sales × 100
Your POS product mix report gives you items sold, and your recipe cards give you plate costs. Compare the result with your actual food cost from inventory. If theoretical is 29 percent and actual is 32 percent on $100,000 of food sales, the three-point gap is $3,000 a month. That money went to waste, over-portioning, spoilage, theft, or counting errors. Close the gap and it drops straight to the bottom line.
Beverage cost works the same way
Run beverage cost separately from food, and split it into liquor, beer, and wine if you can. The period formula is identical: beginning inventory plus purchases minus ending inventory, divided by beverage sales. For a single drink, bartenders call it pour cost.
Pour cost % = ingredient cost of the drink ÷ drink price × 100
Worked example: a 750 ml bottle holds about 25 ounces. At $25 a bottle, that's about $1 an ounce, so a 1.5-ounce pour costs about $1.50. In a $10 cocktail, the spirit alone is a 15 percent pour cost, before mixers and garnish. Jiggers and a pour test for every bartender keep that number from drifting.
What's a good food cost percentage?
Many operators target food cost somewhere around 28 to 35 percent of food sales, but the right number depends on your concept and prices. A steakhouse runs higher than a pizzeria. Watch food and labor together, too, since many operators aim for a prime cost around 60 percent of sales. For how food cost fits into the full P&L, see restaurant profit margins by format.
Food cost formulas at a glance
| Formula | What it tells you |
|---|---|
| (Beginning inventory + purchases minus ending inventory) ÷ food sales | Actual food cost for the period |
| Ingredient cost per plate ÷ menu price | Plate cost percentage for one dish |
| As-purchased cost ÷ yield percentage | True cost of the usable product |
| Plate cost ÷ target food cost percentage | Menu price that hits your target |
| Sum of (plate cost × items sold) ÷ food sales | Theoretical food cost for the period |
Mistakes that throw off food cost
- Mixing food and beverage purchases on the same invoice line or in the same count.
- Skipping counts, or counting at different times each period.
- Stale recipe cards that still carry old prices.
- Ignoring trim and cooking loss on proteins and produce.
- No waste log, so spoilage, dropped plates, and remakes vanish into the total.
- Over-ordering to avoid 86ing a dish, then tossing what's left at the end of the week.
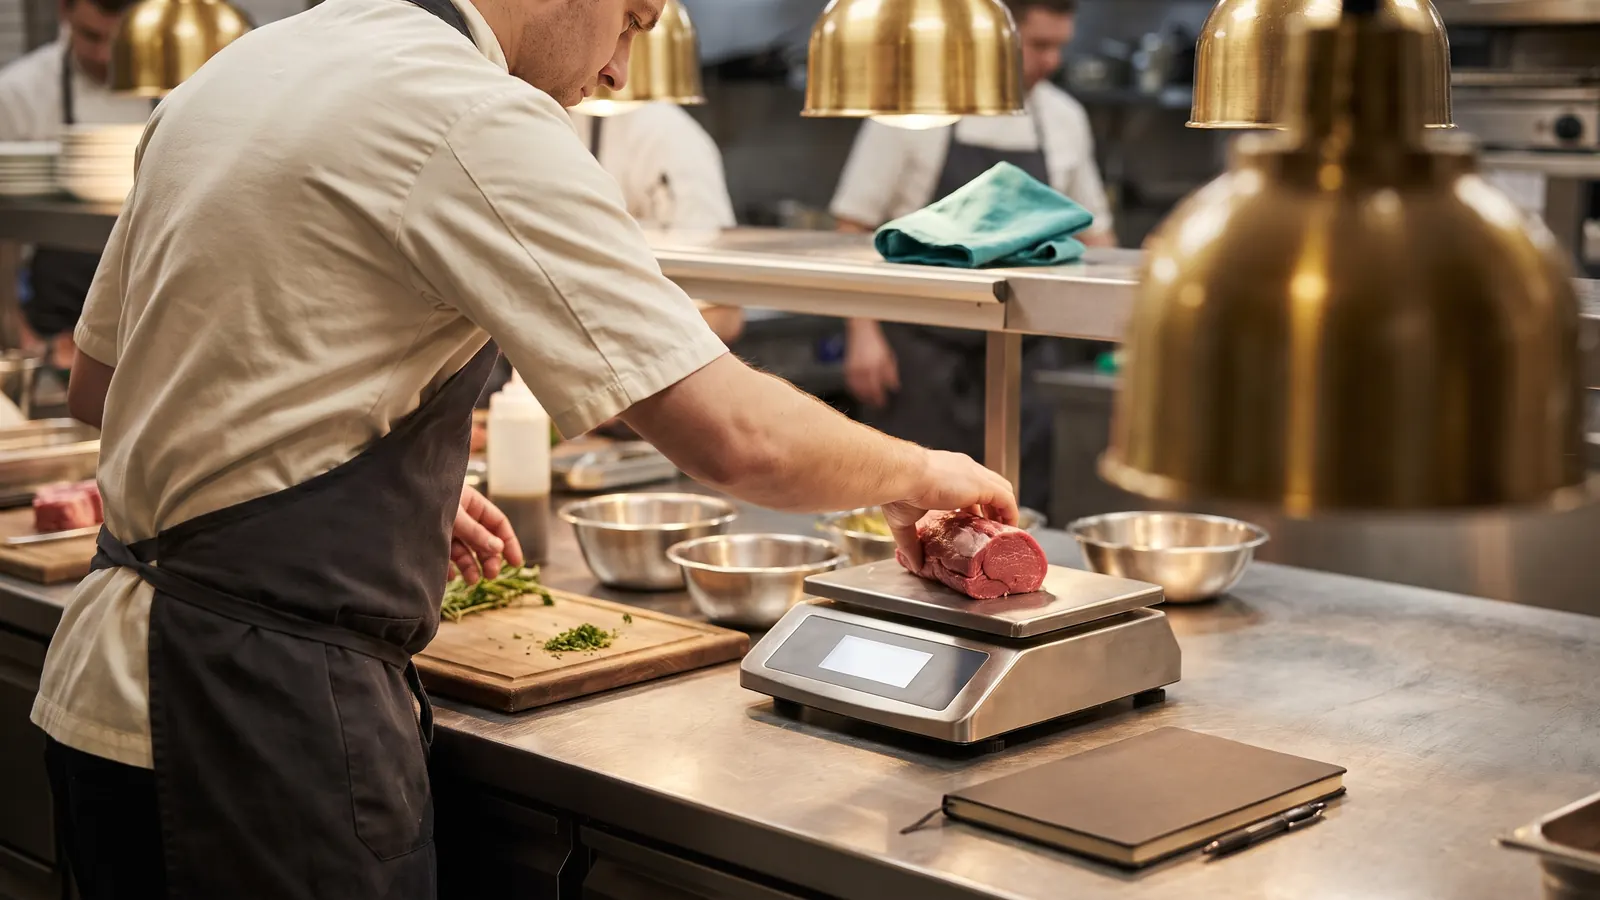
- Portioning by eye. Scales, portion scoops, plating guides, and line training keep every plate consistent, which is why portion standards belong in your restaurant staff training from day one.
If your actual and theoretical numbers won't come together, a restaurant operations consultant can walk the kitchen with you, check counts and yields, and find where the gap starts.
Want a quick outside read on your operation? Get your free AI assessment. Our AI reviews your answers, your Google listing and reviews, and your website, then emails you an evaluation of operations and marketing gaps, and Christy follows up personally.
How Monarch helps
Our restaurant cost control work covers recipe costing, yield tests, inventory routines, menu engineering, and prime cost targets, plus the kitchen SOPs and training that make the numbers stick. You see every recommendation before anything changes, and your feedback shapes each round.
Want help with this?
Monarch handles operations consulting for restaurants as part of one white-glove team. We do the work. You guide the process. See how operations consulting works with us.
Get Your Free AI Assessment